
Implementation of Data Preprocessing on Titanic Dataset
With step by step Implementation

What is Required ?
- Python, Numpy, Pandas
- Kaggle titanic dataset : https://www.kaggle.com/c/titanic-gettingStarted/data
Goal
The machine learning model is supposed to predict who survived during the titanic shipwreck.
Here I will show you how to apply preprocessing techniques on the Titanic dataset.
Why do we need to do Preprocessing ?
For machine learning algorithms to work, it is necessary to convert the raw data into a clean data set and dataset must be converted to numeric data. You have to encode all the categorical lables to column vectors with binary values. Missing values or NaNs in the dataset is an annoying problem. You have to either drop the missing rows or fill them up with a mean or interpolated values..
Note: Kaggle provides 2 datasets: train and results data separately. Both must have same dimensions for the model.
Loading data in pandas
To work on the data, you can either load the CSV in excel software or in pandas. Lets load the csv data in pandas.
df = pd.read_csv('train.csv')
Lets take a look at the data format below
>>> df.info()

<class 'pandas.core.frame.DataFrame'>
Int64Index: 891 entries, 0 to 890
Data columns (total 12 columns):
PassengerId 891 non-null int64
Survived 891 non-null int64
Pclass 891 non-null int64
Name 891 non-null object
Sex 891 non-null object
Age 714 non-null float64
SibSp 891 non-null int64
Parch 891 non-null int64
Ticket 891 non-null object
Fare 891 non-null float64
Cabin 204 non-null object
Embarked 889 non-null object
If you carefully observe the above summary of pandas, there are total 891 rows, Age shows only 714 (means missing), Embarked (2 missing) and Cabin missing a lot as well. Object data types are non-numeric so we have to find a way to encode them to numerical values.
Dropping Columns which are not usefull
Lets try to drop some of the columns which many not contribute much to our machine learning model such as Name, Ticket, Cabin etc.
cols = ['Name', 'Ticket', 'Cabin']
df = df.drop(cols, axis=1)
We dropped 3 columns:
>>>df.info()
PassengerId 891 non-null int64
Survived 891 non-null int64
Pclass 891 non-null int64
Sex 891 non-null object
Age 714 non-null float64
SibSp 891 non-null int64
Parch 891 non-null int64
Fare 891 non-null float64
Embarked 889 non-null object
Dropping rows having missing values Next if we want we can drop all rows in the data that has missing values (NaN). You can do it like
>>> df = df.dropna()

>>> df.info()
Int64Index: 712 entries, 0 to 890
Data columns (total 9 columns):
PassengerId 712 non-null int64
Survived 712 non-null int64
Pclass 712 non-null int64
Sex 712 non-null object
Age 712 non-null float64
SibSp 712 non-null int64
Parch 712 non-null int64
Fare 712 non-null float64
Embarked 712 non-null object
Problem with dropping rows having missing values
After dropping rows with missing values we find that the dataset is reduced to 712 rows from 891, which means we are wasting data. Machine learning models need data for training to perform well. So we preserve the data and make use of it as much as we can. We will see it later.
Creating Dummy Variables
Now we convert the Pclass, Sex, Embarked to columns in pandas and drop them after conversion.
dummies = []
cols = ['Pclass', 'Sex', 'Embarked']
for col in cols:
   dummies.append(pd.get_dummies(df[col]))
then
titanic_dummies = pd.concat(dummies, axis=1)
We have 8 columns transformed to columns where 1,2,3 represents passenger class.
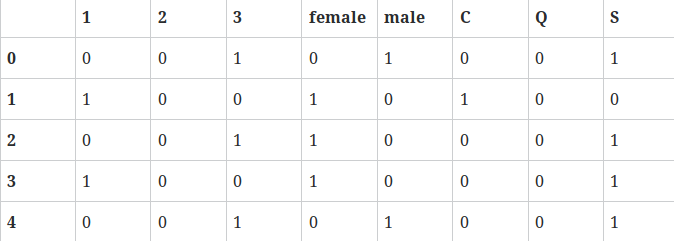
And finally we concatenate to the original dataframe column wise
df = pd.concat((df,titanic_dummies), axis=1)
Now that we converted Pclass, Sex, Embarked values into columns, we drop the redundant same columns from the dataframe
df = df.drop(['Pclass', 'Sex', 'Embarked'], axis=1)
Lets take a look on the new dataframe
>>>df.info()
PassengerId 891 non-null int64
Survived 891 non-null int64
Age 714 non-null float64
SibSp 891 non-null int64
Parch 891 non-null int64
Fare 891 non-null float64
1 891 non-null float64
2 891 non-null float64
3 891 non-null float64
female 891 non-null float64
male 891 non-null float64
C 891 non-null float64
Q 891 non-null float64
S 891 non-null float64
Taking Care of Missing Data
All is good, except age which has lots of missing values. Lets compute a median or interpolate() all the ages and fill those missing age values. Pandas has a interpolate() function that will replace all the missing NaNs to interpolated values.
df['Age'] = df['Age'].interpolate()
Now lets observe the data columns. Notice age which is interpolated now with imputed new values.
>>>df.info()
Data columns (total 14 columns):
PassengerId 891 non-null int64
Survived 891 non-null int64
Age 891 non-null float64
SibSp 891 non-null int64
Parch 891 non-null int64
Fare 891 non-null float64
1 891 non-null float64
2 891 non-null float64
3 891 non-null float64
female 891 non-null float64
male 891 non-null float64
C 891 non-null float64
Q 891 non-null float64
Converting the dataframe to numpy
Now that we have converted all the data to numeric, its time for preparing the data for machine learning models. This is where scikit and numpy come into play:
X = Input set with 14 attributes
y = Small y Output, in this case ‘Survived’
Now we convert our dataframe from pandas to numpy and we assign input and output
X = df.values
y = df['Survived'].values
X has still Survived values in it, which should not be there. So we drop in numpy column which is the 1st column.
X = np.delete(X, 1, axis=1)
Dividing data set into training set and test set
Now that we are ready with X and y, lets split the dataset for 70% Training and 30% test set using scikit model_selection
from sklearn.model_selection import train_test_split
X_train, X_test, y_train, y_test = train_test_split(X, y, test_size=0.3, random_state=0)
And That’s about it folks.
You have learned how to preprocess data in the titanic dataset. So go on, try it for yourself and start making your own predictions.